RESEARCH TO POLICY: SOCIAL INNOVATION
Voting Technology Project releases report

Managing Polling Place Resources
from Polling Place of the Future Project
by MIT political scientist Charles Stewart III


Part of the "Polling Place of the Future Project" of the Voting Technology Project, this report takes several new steps in the effort to spread the word about the usefulness of applying queuing theory to improve polling place practices.


Report released November 16, 2015

Download the report: Managing Polling Places Resources


Just as the one-year count-down for the 2016 presidential election has begun, the Caltech/MIT Voting Technology Project has released a new report about managing polling place resources.  Click here for the executive summary, and here for the full report.

Part of the Polling Place of the Future Project of the Voting Technology Project (VTP), this report serves as a companion to a set of Web-based tools that the VTP developed and posted at the request of the bipartisan Presidential Commission on Election Administration (PCEA), to facilitate the recommendation that local jurisdictions “develop models and tools to assist them in effectively allocating resources across polling places.”
 

Spreading the word

The report takes several new steps in the effort to spread the word about the usefulness of applying queuing theory to improve polling place practices. First, it provides a single source of facts about lines at polling places in 2012 (with some updating to 2014).  Second, it provides a brief, intuitive introduction to queuing theory as applied to polling places — with a brief list of suggested readings for those who would like to learn more.  Finally, the report uses data from two actual local election jurisdictions and walks through “what-if analyses” that rely on the application of the resource allocation tools.


Sharing the basic facts

The report also provides basic facts about where long lines were experienced in 2012 and which voters — based on race, voting mode, and residence — waited longer than others. Information about the 2014 election updates previous research, and underscores how long lines tend to be more prevalent in on-year (presidential) elections than in midterm elections. 

Beyond providing basic facts about the location of lines in American elections, the report provides a basic introduction to the science of line management, queuing theory, and a list of further readings for those who wish to delve more deeply into the subject. Finally, this report demonstrates how the Web-based tools might be used, by working through actual data from two local jurisdictions.


Online "Allocation Calculator Tools" used by thousands around the globe

In support of the PCEA’s work, the VTP had already assembled and published a set of online tools — the  resource allocation calculators — which help election administrators plan for smooth voting experiences. The PCEA report highlighted the need for these calculators and recommended their use.

Since the release of the PCEA report, the VTP calculator website has been visited thousands of times by users across the country (and around the world.)  Numerous jurisdictions have sent positive feedback about the utility of these calculators, as state and local officials try to effectively allocate their limited resources.

In recent months, two of the resource calculators have been updated, and those updates have been posted on the site. The new versions include improvements to the user interfaces and the ability to upload data from multiple precincts, which allows the simultaneous analysis of hundreds of polling places for large jurisdictions.

Election administrators are always looking for ways to improve the experience for voters, and this report is timed to allow election administrators to prepare and fine-tune their plans for November 2016.  


Executive Summary
Managing Polling Place Resources


The bipartisan Presidential Commission on Election Administration (PCEA) was appointed in 2013, following a national election in which long lines were emblematic of challenges facing election administration in the United States.

In its January 2014 report, the PCEA called for the development of models and tools to assist local jurisdictions in more effectively allocating resources, such as poll books and voting booths, so that lines might be made shorter and the voting process might unfold more smoothly.


A set of online tools help officials make voting smoother and faster for citizens

In response to a request by the PCEA, the Caltech/MIT Voting Technology Project developed a web site that hosts three web-based tools that allow election officials to take information they have about the configuration of their polling places and find out whether they have sufficient resources to serve voters in a timely fashion. All the tools are available on the Voting Technology Project website.

This report serves as a companion to those web-based tools. It provides basic facts about where long lines were experienced in 2012 and which voters — based on race, voting mode, and residence — waited longer than others. Information about the 2014 election updates previous research, and underscores how long lines tend to be more prevalent in on-year (presidential) elections than in midterm elections.

Beyond providing basic facts about the location of lines in American elections, the report provides a basic introduction to the science of line management, queuing theory, and a list of further readings for those who wish to delve more deeply into the subject. Finally, this report demonstrates how the Web-based tools can be used, by working through actual data from two local jurisdictions.


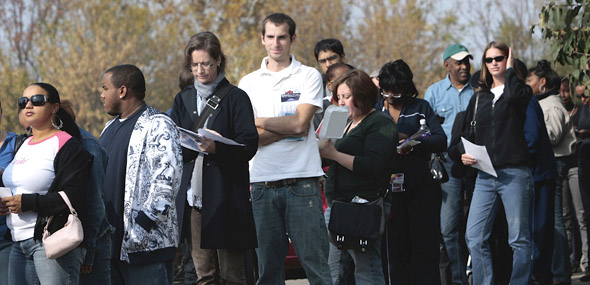
Outside an early-voting location November 2, 2008, Columbus, Ohio. Photocredit:Chris Hondros


Election administrators face many challenges planning for and running elections. The Voting Technology Project website offers a toolkit based on the expertise of election administrators, business managers, and social science researchers that can help election administrators plan and conduct elections.

Problems with long lines in presidential elections tend to be the longest in the states along the southeastern seaboard, in cities throughout the country, during early voting, and among African Americans. Election officials can respond by addressing structural matters (such as election laws) and fundamental resource levels (such as the number of poll books and scanners) that lead to chronic levels of long lines.


Basic facts

Long lines on Election Day can be a visible indicator that polling place resources have been inadequately deployed to serve the needs of voters in a polling place. The great visibility of lines in news reports on Election Day obscures the fact that long lines are far from universal, even in presidential elections, and tend to beset only a limited number of places. In 2012, 2/3 of all in-person voters waited less than 10 minutes to vote. Only about one voter in eight waited to vote longer than the PCEA benchmark of 30 minutes.

Problems with long lines in presidential elections are focused on readily identified places. Average wait times tend to be the longest in the states along the southeastern seaboard, in cities throughout the country, during early voting, and among African Americans.

Although some election officials and commentators prefer to blame long lines on one-off events, such as unusually long ballots or surges in voters brought on by political campaigns, the length of wait times in one election is highly predictive of the wait times in the next election. This suggests that in the parts of the country where lines are the longest, election officials should work to address structural matters (such as election laws) and fundamental resource levels (such as the number of poll books and scanners) that lead to chronic levels of long lines.


Queuing theory is well established

Modern management science, particularly the field of operations research, provides a set of long-established insights and modes of analysis that help the private sector manage demand for services across a large swath of the modern economy. Unfortunately, queuing theory, which is the specific set of approaches to managing lines, has not penetrated very far into the management of resources for elections.

Although queuing theory is rigorous and mathematical, the basics are easily grasped through intuition. Most fundamentally, long lines occur when the resources are insufficient to handle demand. Line dynamics are nonlinear, that is, they can grow out of control even when the inputs to the system change only a little.

Lines can be managed if administrators focus on three quantities in the polling place: the arrival rates of voters, the number of places voters are served, and how long it takes to serve voters. It is these quantities that are the focus of the discussion about how to minimize polling place lines.


Applying queuing theory to manage polling places

Roughly half of the report is spent describing the practical aspects of putting queuing theory into practice in polling places. The application of queuing theory starts with carefully understanding how each polling place is organized and by carefully measuring the core quantities of interest that involve voters: arrival rates and service times. Then, using actual data from two jurisdictions, the report walks through how basic inputs can be used to analyze where problem areas might exist, and how “what-if” analyses can be performed to add or shift resources (e.g. poll books and voting booths) in order to reduce the lines voters experience.

The Polling Place of the Future Project is supported by a grant from the Democracy Fund


Suggested Links

Full Report: Managing Polling Places Resources

Voting Technology Project: Online Election Management Toolkit
Three web-based tools that allow election officials to take information they have about the configuration of their polling places and find out whether they have sufficient resources to serve voters in a timely fashion.

Caltech/MIT Voting Technology Project

Charles Stewart III

MIT Department of Political Science

Democracy Fund

Archive: Profile of Charles Stewart: Making technology safe for democracy

Archive: Study aims to shorten election day lines

Archive: Stewart ranks voting systems in the 50 U.S. states

Archive: The states of the U.S. election system

Archive: Political Science and EECS join forces for voting technology course

News on report from Election Updates at CalTech